- Go directly to quantization demo
- Go directly to paper describing the results

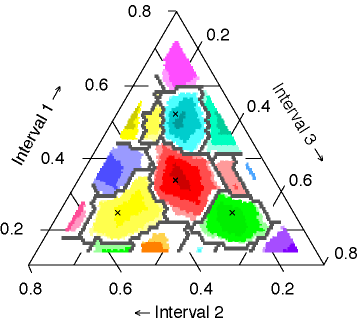
N.B. The current demo is a draft version with little additional explanation. For more details on, e.g., the experimental design and representation used, see Desain & Honing (2003).

Figure. Rhythm space (a), ternary plot (b), and two pattern examples (c). The triangular slice in a represents the patterns of three time intervals and one second total duration. The ternary plot (b, the triangular slice shown from above) shows the sampling of rhythm space, each dot representing a stimulus. The grid can be interpreted following the direction of the tick marks along the axes. As an example (c), two rhythms are marked in the sampled rhythm space.